Water quality at the mass emission Stations in Ventura County is generally good but does fluctuate from year to year, usually associated with changes in salts and bacteria in dry weather, and salts and metals in wet weather. Mass emission stations are located in the lower reaches of the three major Ventura County watersheds: Calleguas Creek (ME-CC), Ventura River (ME-VR), and Santa Clara River (ME-SCR). Mass Emission drainage areas are large and include multiple sources of discharge, including natural sources, wastewater treatment plants, municipal and agricultural sources, and groundwater discharges.
Figure 1. WQI Rating System
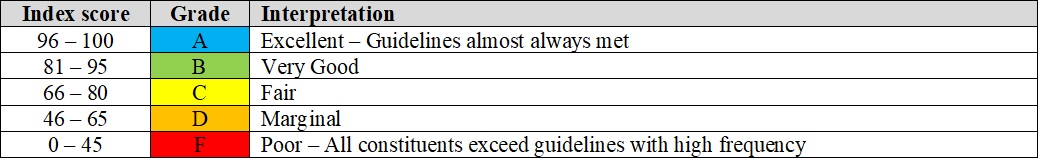
Index values are calculated annually for the six variable groups for each watershed, and separately for dry and wet weather events. The latter is important because water quality and pollutants of concern are often different during dry and wet weather, as our Mediterranean climate produces little rain between May and September. The sub-indices are then averaged to produce an overall River Water Quality Index for dry and wet weather events. Multiple indices can also be averaged to obtain an Index for all watersheds combined, or for dry and wet weather combined.
Figure 2. 2021/22 WQI Grades
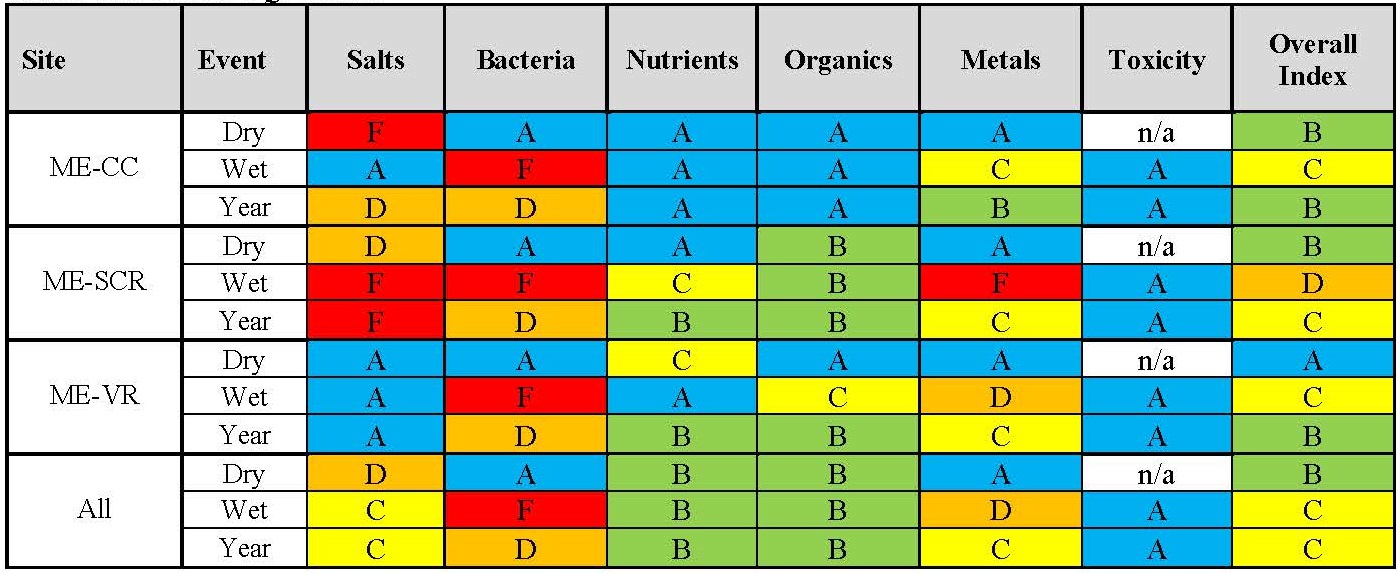
Overall dry weather grades at ME-SCR and ME-VR are typically good with A to B grades in all years. Overall dry weather grades at ME-CC exhibit greater variability in the range of B and C grades, mostly due to changes in salts, bacteria, and organics scores. The overall wet weather grade in 2021/22 held steady for ME-CC and was only one point below improving to a B, however, a significant improvement in salts score wasn’t quite enough to counteract a decreased metals score. ME-CC improved to a B in dry weather, largely due to a better bacteria score, despite a drop in salts score. Dry weather grades held steady for ME-VR and ME-SCR. Wet weather grades dropped for ME-SCR due to decreases in scores for salts, nutrients, and metals (despite increases in scores for bacteria and organics). Wet weather grades also dropped for ME-VR (due to decreased scores for metals and organics) resulting in an overall drop across the county. Lower scores are typically affected by salts in dry weather, and salts, metals and bacteria in wet weather.
Figure 3. Combined Wet and Dry WQI Trends for Each Receiving Water Station

Fluctuations in grades are usually associated with changes in salts and bacteria in dry weather, and salts and metals in wet weather. Notable events include the 2004/05 year, which was the second wettest year on record for Ventura County, with poor scores observed at all sites in wet weather. The 2020/21 year was the driest year on record for Ventura County, however no corresponding difference in scores was noted. The Thomas Fire in 2017/18 heavily impacted the Ventura River Watershed and likely caused the decreased scores at ME-VR (metals and toxicity in wet weather and bacteria, reducing the scores overall. The Ventura River Watershed appears to have rebounded significantly since then. A more detailed discussion is available in the monitoring section of our annual reports, beginning with the 2012/13 monitoring year (December 2013 report).
Figure 4. WQI Trends for All Locations Combined
